prometheus安装
安装方式
源码安装
dcoker安装
二进制安装
helm安装
可以从 ArtifactHUB 下载安装包
安装
helm
这里选择使用 helm 安装
添加helm仓库
helm repo add prometheus-community https://prometheus-community.github.io/helm-charts
下载包
helm pull prometheus-community/prometheus
解压缩
tar xf prometheus-25.21.0.tgz
安装
说明
在安装之前可以对 values.yaml 中的相关配置进行修改,例如配置svc类型、配置ingress域名、资源限制等等
$ helm upgrade --install prometheus -n monitor --create-namespace .
Release "prometheus" does not exist. Installing it now.
NAME: prometheus
LAST DEPLOYED: Wed May 29 21:09:44 2024
NAMESPACE: monitor
STATUS: deployed
REVISION: 1
TEST SUITE: None
NOTES:
The Prometheus server can be accessed via port 80 on the following DNS name from within your cluster:
prometheus-server.monitor.svc.cluster.local

From outside the cluster, the server URL(s) are:
http://p8s.ops.com


The Prometheus alertmanager can be accessed via port 9093 on the following DNS name from within your cluster:
prometheus-alertmanager.monitor.svc.cluster.local


Get the Alertmanager URL by running these commands in the same shell:
  export POD_NAME=$(kubectl get pods --namespace monitor -l "app.kubernetes.io/name=alertmanager,app.kubernetes.io/instance=prometheus" -o jsonpath="{.items[0].metadata.name}")
  kubectl --namespace monitor port-forward $POD_NAME 9093
#################################################################################
######   WARNING: Pod Security Policy has been disabled by default since    #####
######            it deprecated after k8s 1.25+. use                        #####
######            (index .Values "prometheus-node-exporter" "rbac"          #####
###### .          "pspEnabled") with (index .Values                         #####
######            "prometheus-node-exporter" "rbac" "pspAnnotations")       #####
######            in case you still need it.                                #####
#################################################################################


The Prometheus PushGateway can be accessed via port 9091 on the following DNS name from within your cluster:
prometheus-prometheus-pushgateway.monitor.svc.cluster.local


Get the PushGateway URL by running these commands in the same shell:
  export POD_NAME=$(kubectl get pods --namespace monitor -l "app=prometheus-pushgateway,component=pushgateway" -o jsonpath="{.items[0].metadata.name}")
  kubectl --namespace monitor port-forward $POD_NAME 9091

For more information on running Prometheus, visit:
https://prometheus.io/
查看pod状态
$ kubectl get pods|grep prometheus
prometheus-alertmanager-0                            1/1     Running   0          3h3m
prometheus-prometheus-node-exporter-48v5z            1/1     Running   0          3h3m
prometheus-prometheus-node-exporter-b9qcw            1/1     Running   0          3h3m
prometheus-prometheus-node-exporter-nnqv8            1/1     Running   0          3h3m
prometheus-prometheus-node-exporter-rsj5p            1/1     Running   0          3h3m
prometheus-prometheus-pushgateway-7c758897fd-bwbvx   1/1     Running   0          3h3m
prometheus-server-69786c785-vbzbb                    2/2     Running   0          3h3m
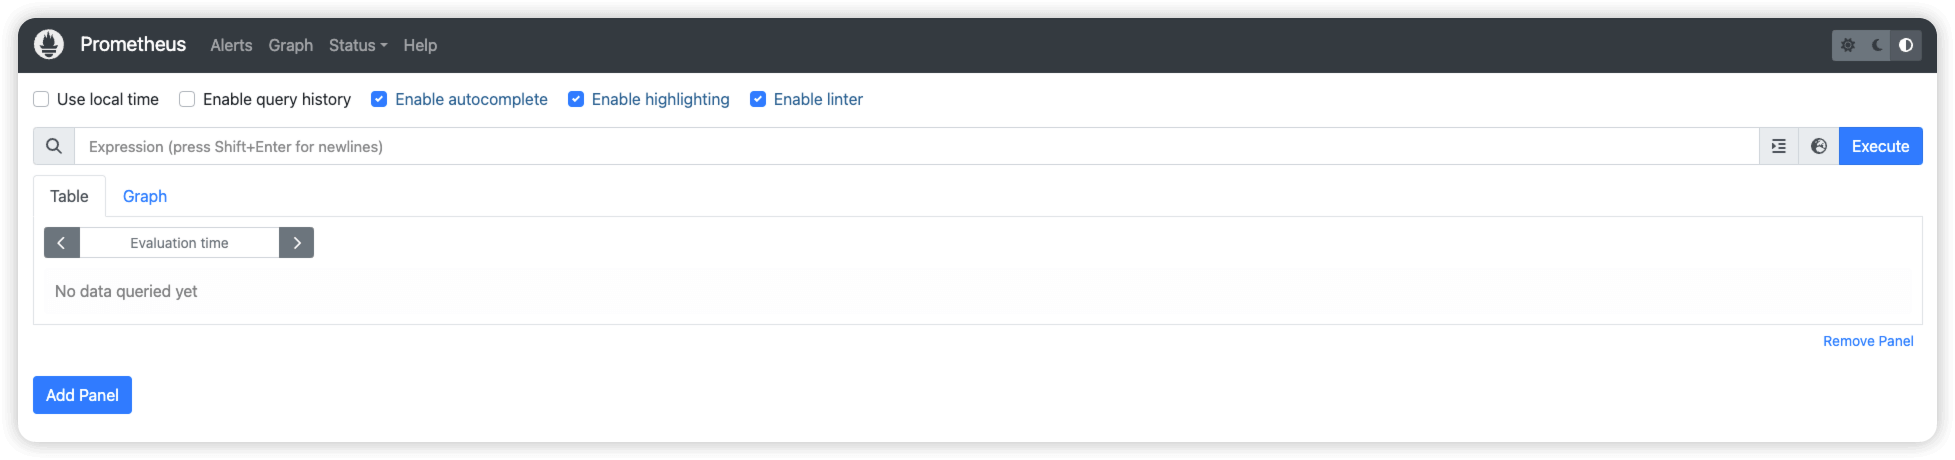
访问
默认界面如下
二进制安装
下载安装包
https://github.com/prometheus/prometheus/releases/download/v2.53.1/prometheus-2.53.1.linux-arm64.tar.gz
解压缩
tar xf prometheus-2.53.1.linux-arm64.tar.gz
查看目录内容
$ ll
total 255632
drwxr-xr-x 2 1001 127        38 Jul 10 18:31 console_libraries
drwxr-xr-x 2 1001 127       173 Jul 10 18:31 consoles
-rw-r--r-- 1 1001 127     11357 Jul 10 18:31 LICENSE
-rw-r--r-- 1 1001 127      3773 Jul 10 18:31 NOTICE
-rwxr-xr-x 1 1001 127 134834183 Jul 10 18:20 prometheus
-rw-r--r-- 1 1001 127       934 Jul 10 18:31 prometheus.yml
-rwxr-xr-x 1 1001 127 126906727 Jul 10 18:20 promtool
启动
说明
默认情况下,prometheus时序数据库(TSDB)数据的存储路径是 ./data,可以通过 --storage.tsdb.path 参数指定
可通过 --config.file 参数指定配置文件
注意
启动prometheus的时候需要加上 --web.enable-lifecycle 参数才可以执行热加载prometheus配置文件
否则会报错如下
$ curl -X POST http://127.0.0.1:9090/-/reload
Lifecycle API is not enabled.
./prometheus --config.file=prometheus.yml --web.enable-lifecycle
查看启动,prometheus默认监听9090端口
$ netstat -ntpl | grep prometheus
tcp6       0      0 :::9090                 :::*                    LISTEN      1479/./prometheus